library(tidyverse)
library(viridis)
library(lubridate)Lab 06: Data Importing & Cleaning
Intro Survey
data cleaning
data wrangling
data visualization
survey data
Goals
In this lab, you will…
- Develop proficiency cleaning survey data
- Consider implications of question types (e.g., multiple choice, select all that apply, open-ended) on data quality and analysis
- Wrangle data to create desired visualizations
- Discover interconnections between data cleaning, analysis, and communication strategies
Getting started
- Go to our class GitHub repo and download the
.qmdfile for this lab. - Refer back to Lab 01 for instructions on how to get started on a lab.
- You will work in your Lab 06–07 groups (see Blackboard).
Packages
We will use the tidyverse package for this assignment, and you’ll need lubridate to work with dates. If you wish to use the viridis color palettes, you will need the viridis package as well.
Data
The data come from an intro survey I give my Intro Stats students. Emails and names have been removed for anonymity. We’ll read in the data from a url:
survey <- read_csv("https://docs.google.com/spreadsheets/d/e/2PACX-1vSWWS4oNf69Rhx9COxKH445CXPl2xq7FpyabaMFpib8f9bFBFDuznskYfWIi97e8lQYl-q1M6zZ62RR/pub?output=csv")The data are currently in the form exactly as provided from a Google Form. You will need to take many necessary cleaning steps to get it in a form that is appropriate for analysis.
Exercises
NoteExercise 3
Reproduce the following visualization. Note, you will need to re-order the levels of your year variable.
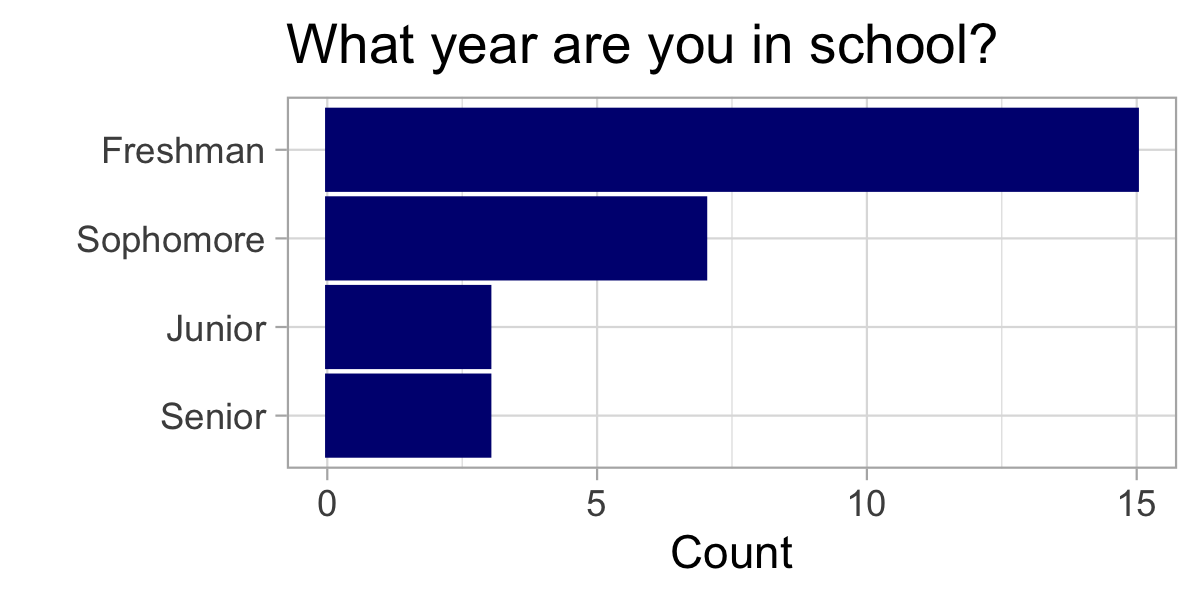
Hint: theme_light() and the color navyblue were used
NoteExercise 6
Reproduce the following visualization. Note, you may need to re-order the levels of your variable.
Hint: Set y = 1 inside your aes() function. And add a theme layer where axis.text.y and axis.ticks.y are set equal to element_blank()
Note: ChatGPT/AI can be helpful in providing an initial solution to a tedious task like this, but make sure to review its suggestions and override if necessary - you are the analyst, responsible for analysis decisions!
The grepl() function searches for a given string (e.g. “Mac laptop”) in a given object (laptop). It returns the value TRUE if the string is present, and FALSE if it is not. Combined with the if_else() statement, this results in the new variable having the value “Yes” if the string is found and “No” if it is not.
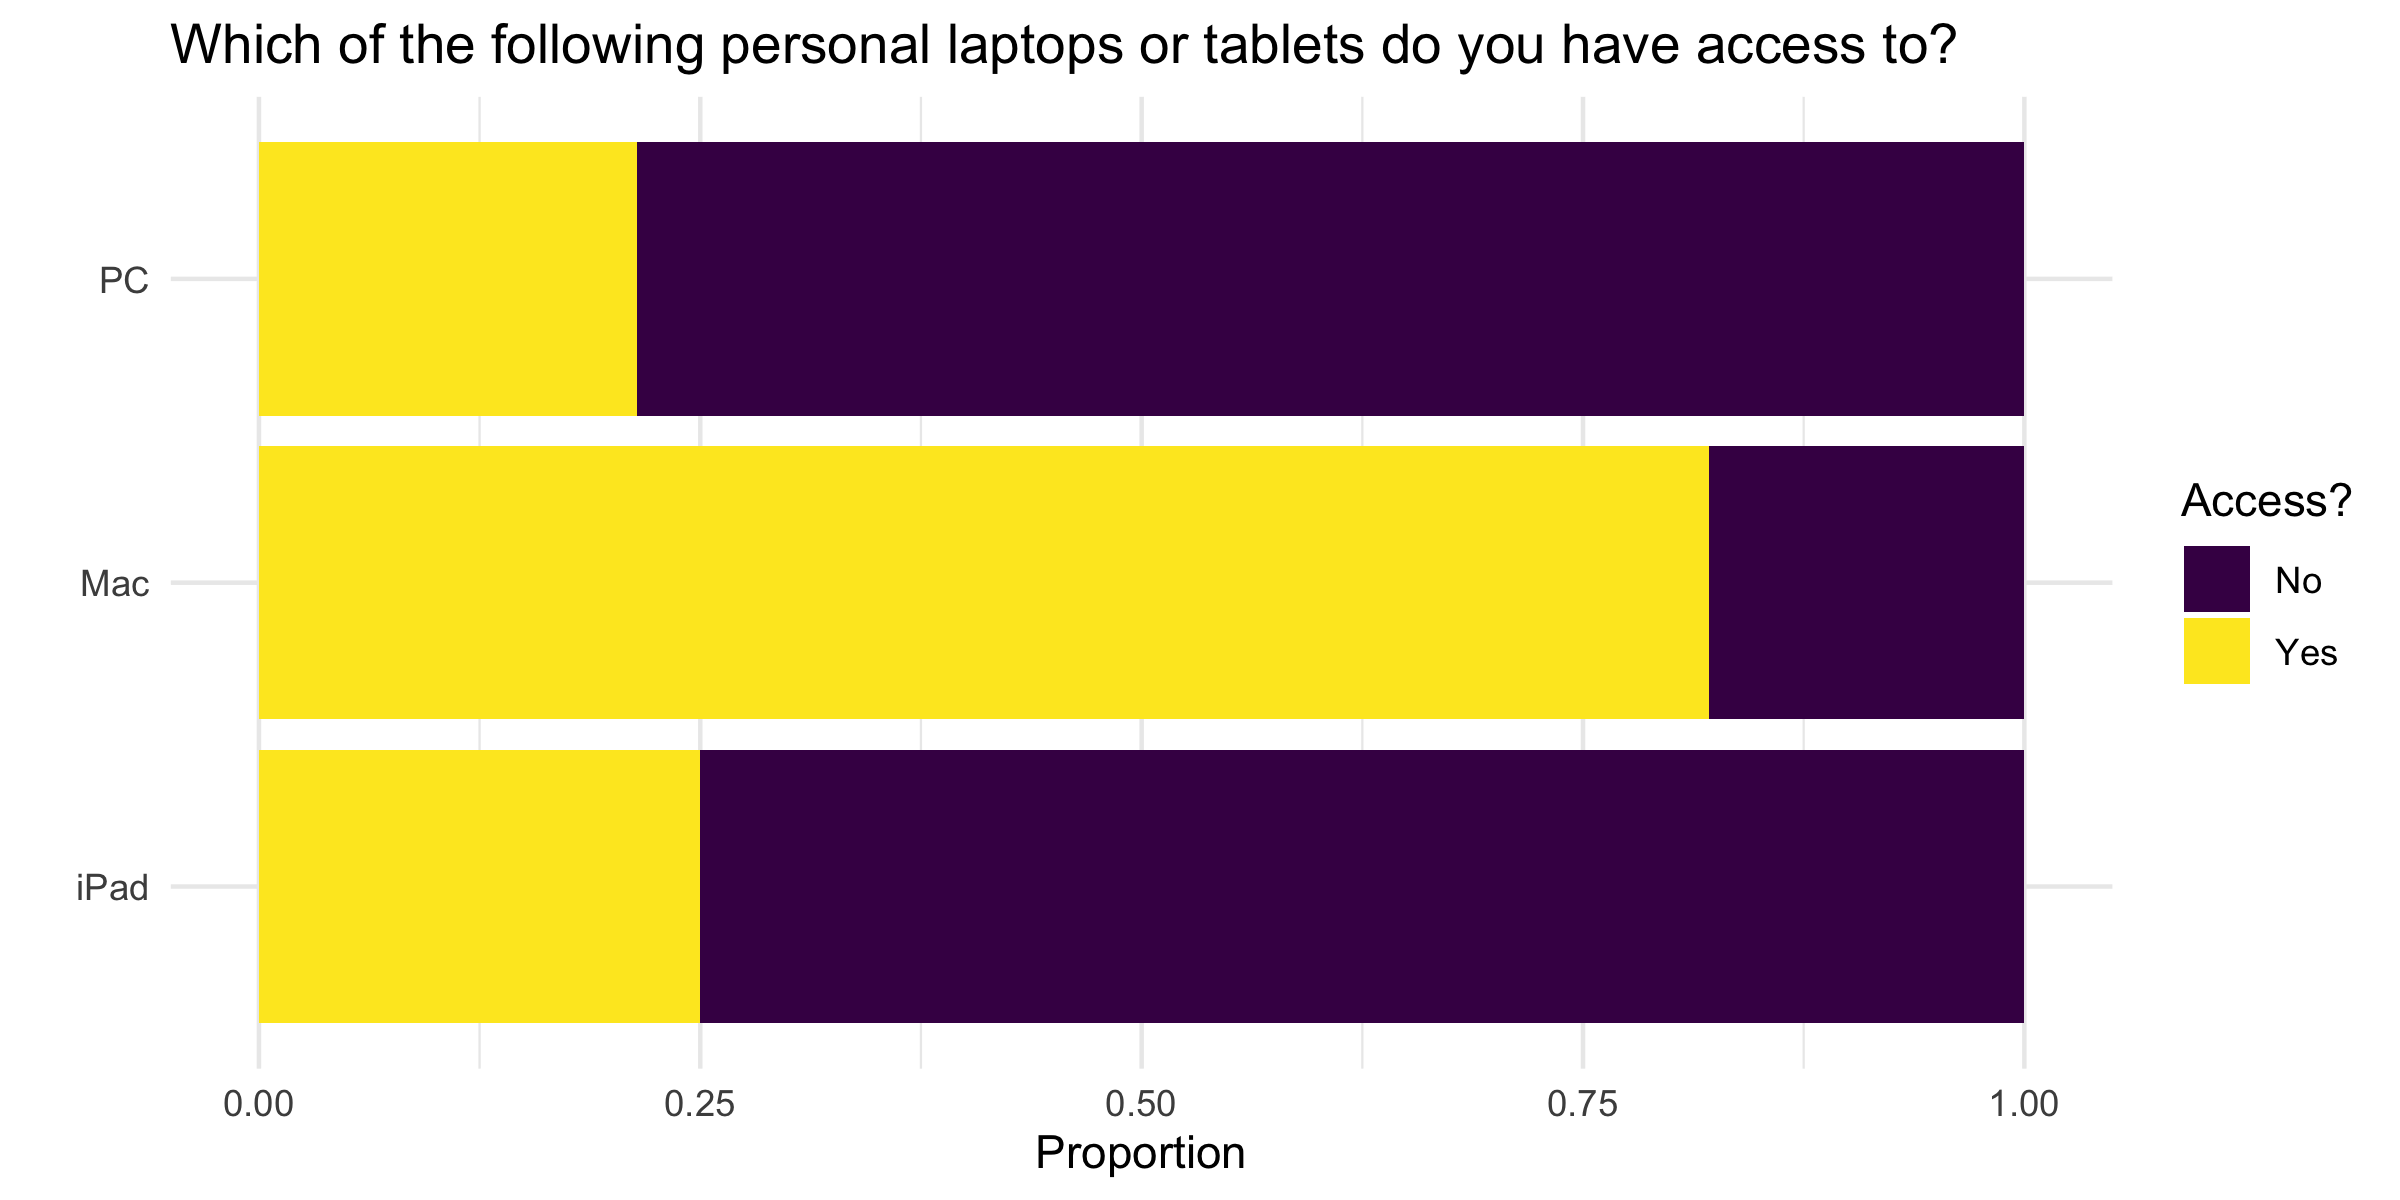
NoteExercise 8
- Use a
pivot_longerto pivot the columnsMac:PC. - Consider using
names_to = "laptop_type"andvalues_to = "laptop_access"to name the new pivoted columns. - Then, recreate the following visualization.
See the GIF below as a reminder of how pivot_longer() works
Hint: the function month() applied to a date will extract just the month, year() will extract the year, etc, which may helpful in determining semester.
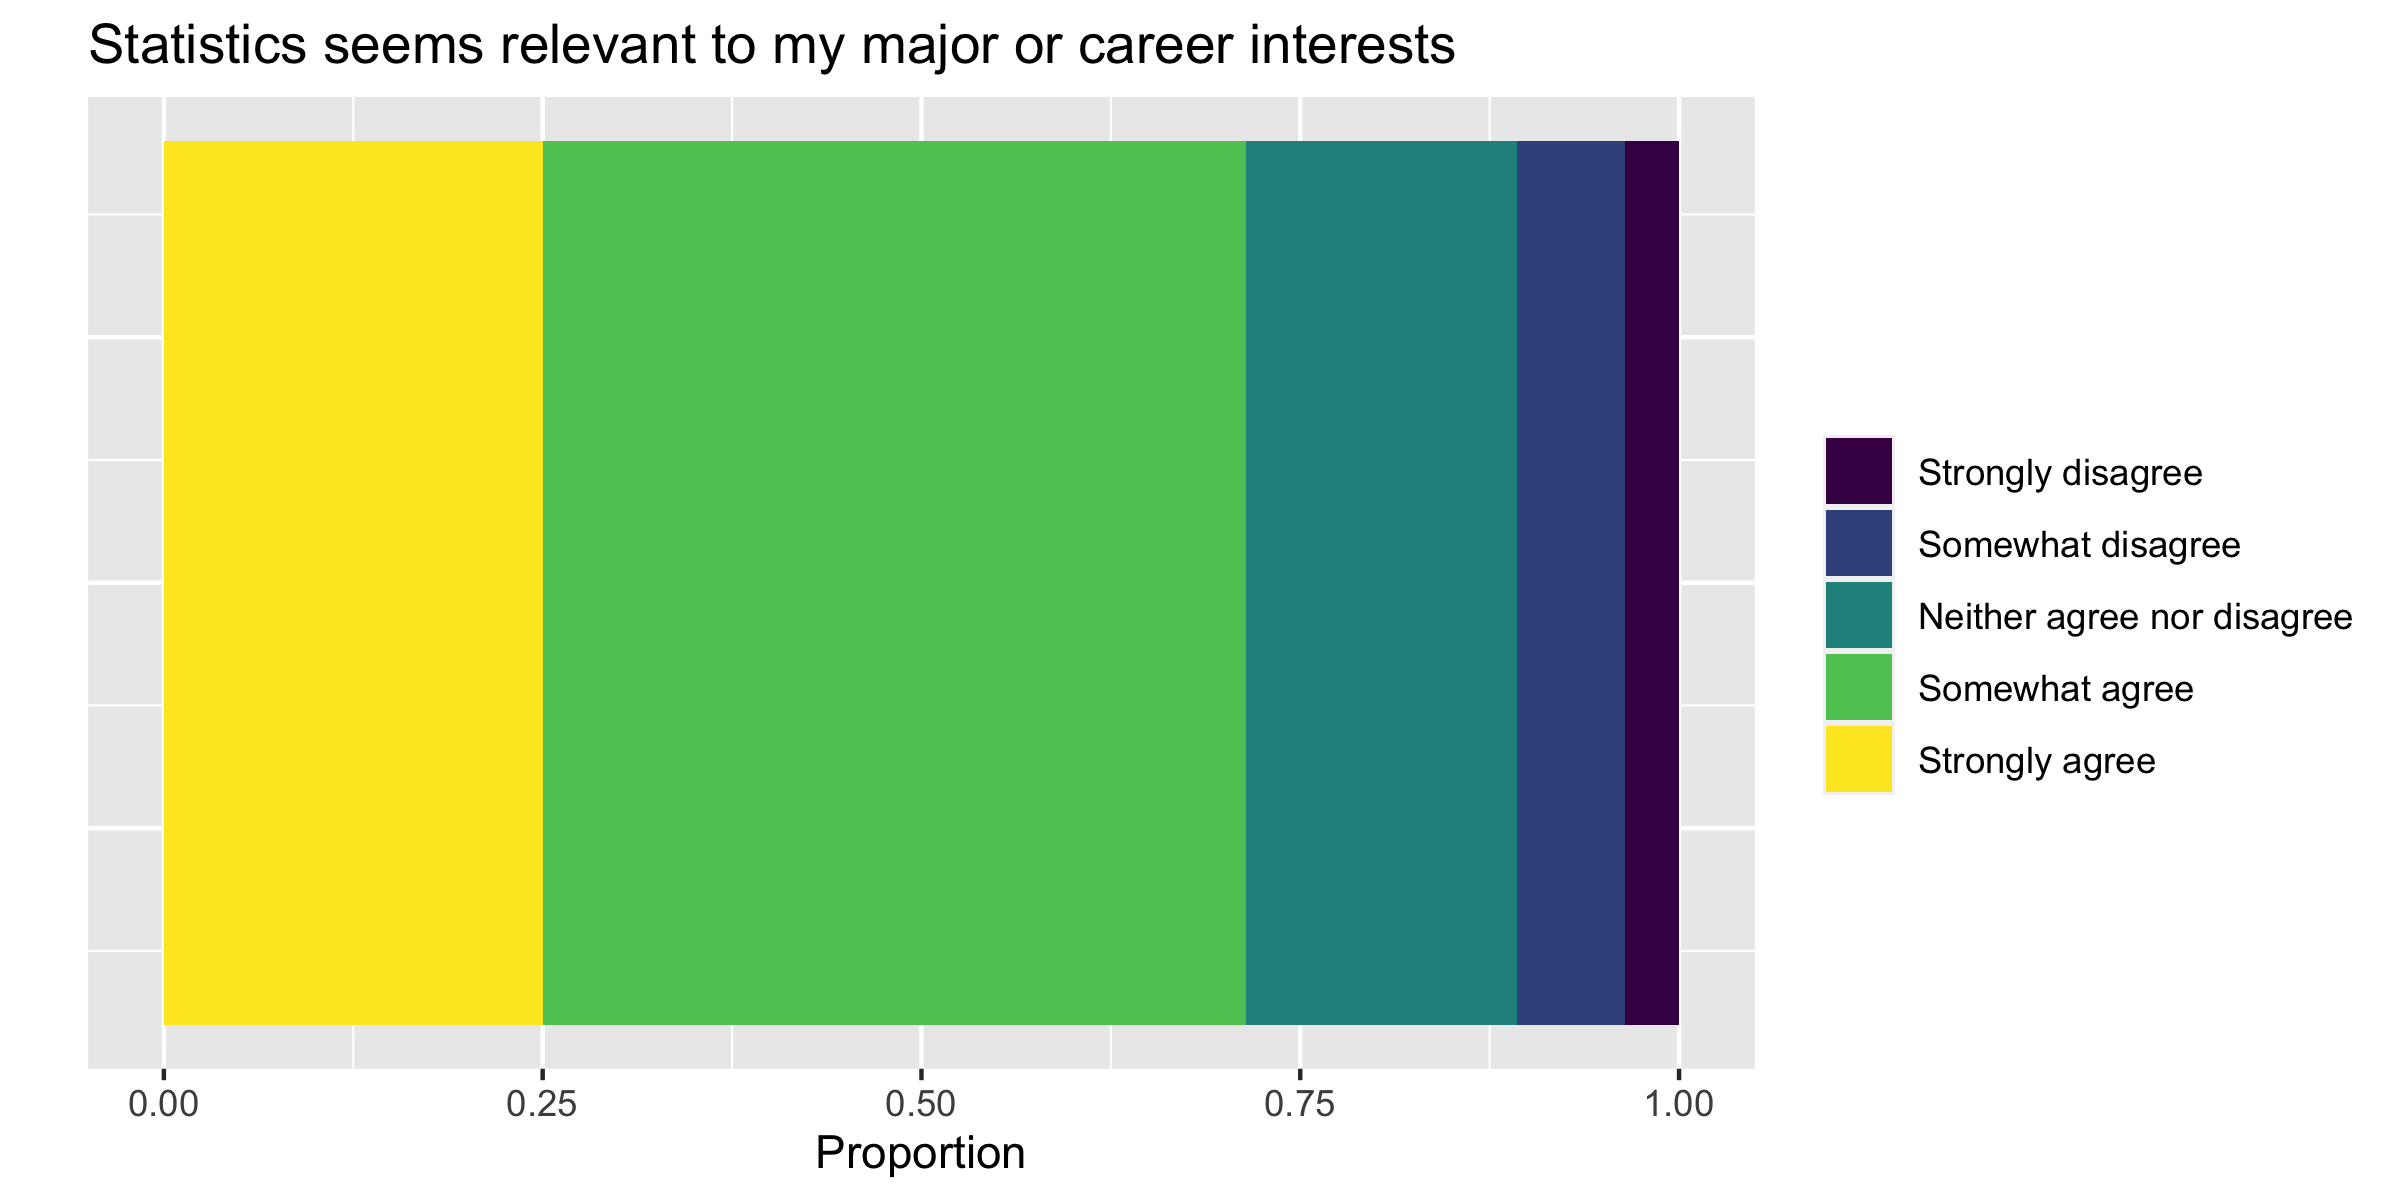
NoteBONUS 2
Attempt to recreate this visualization as closely as possible.
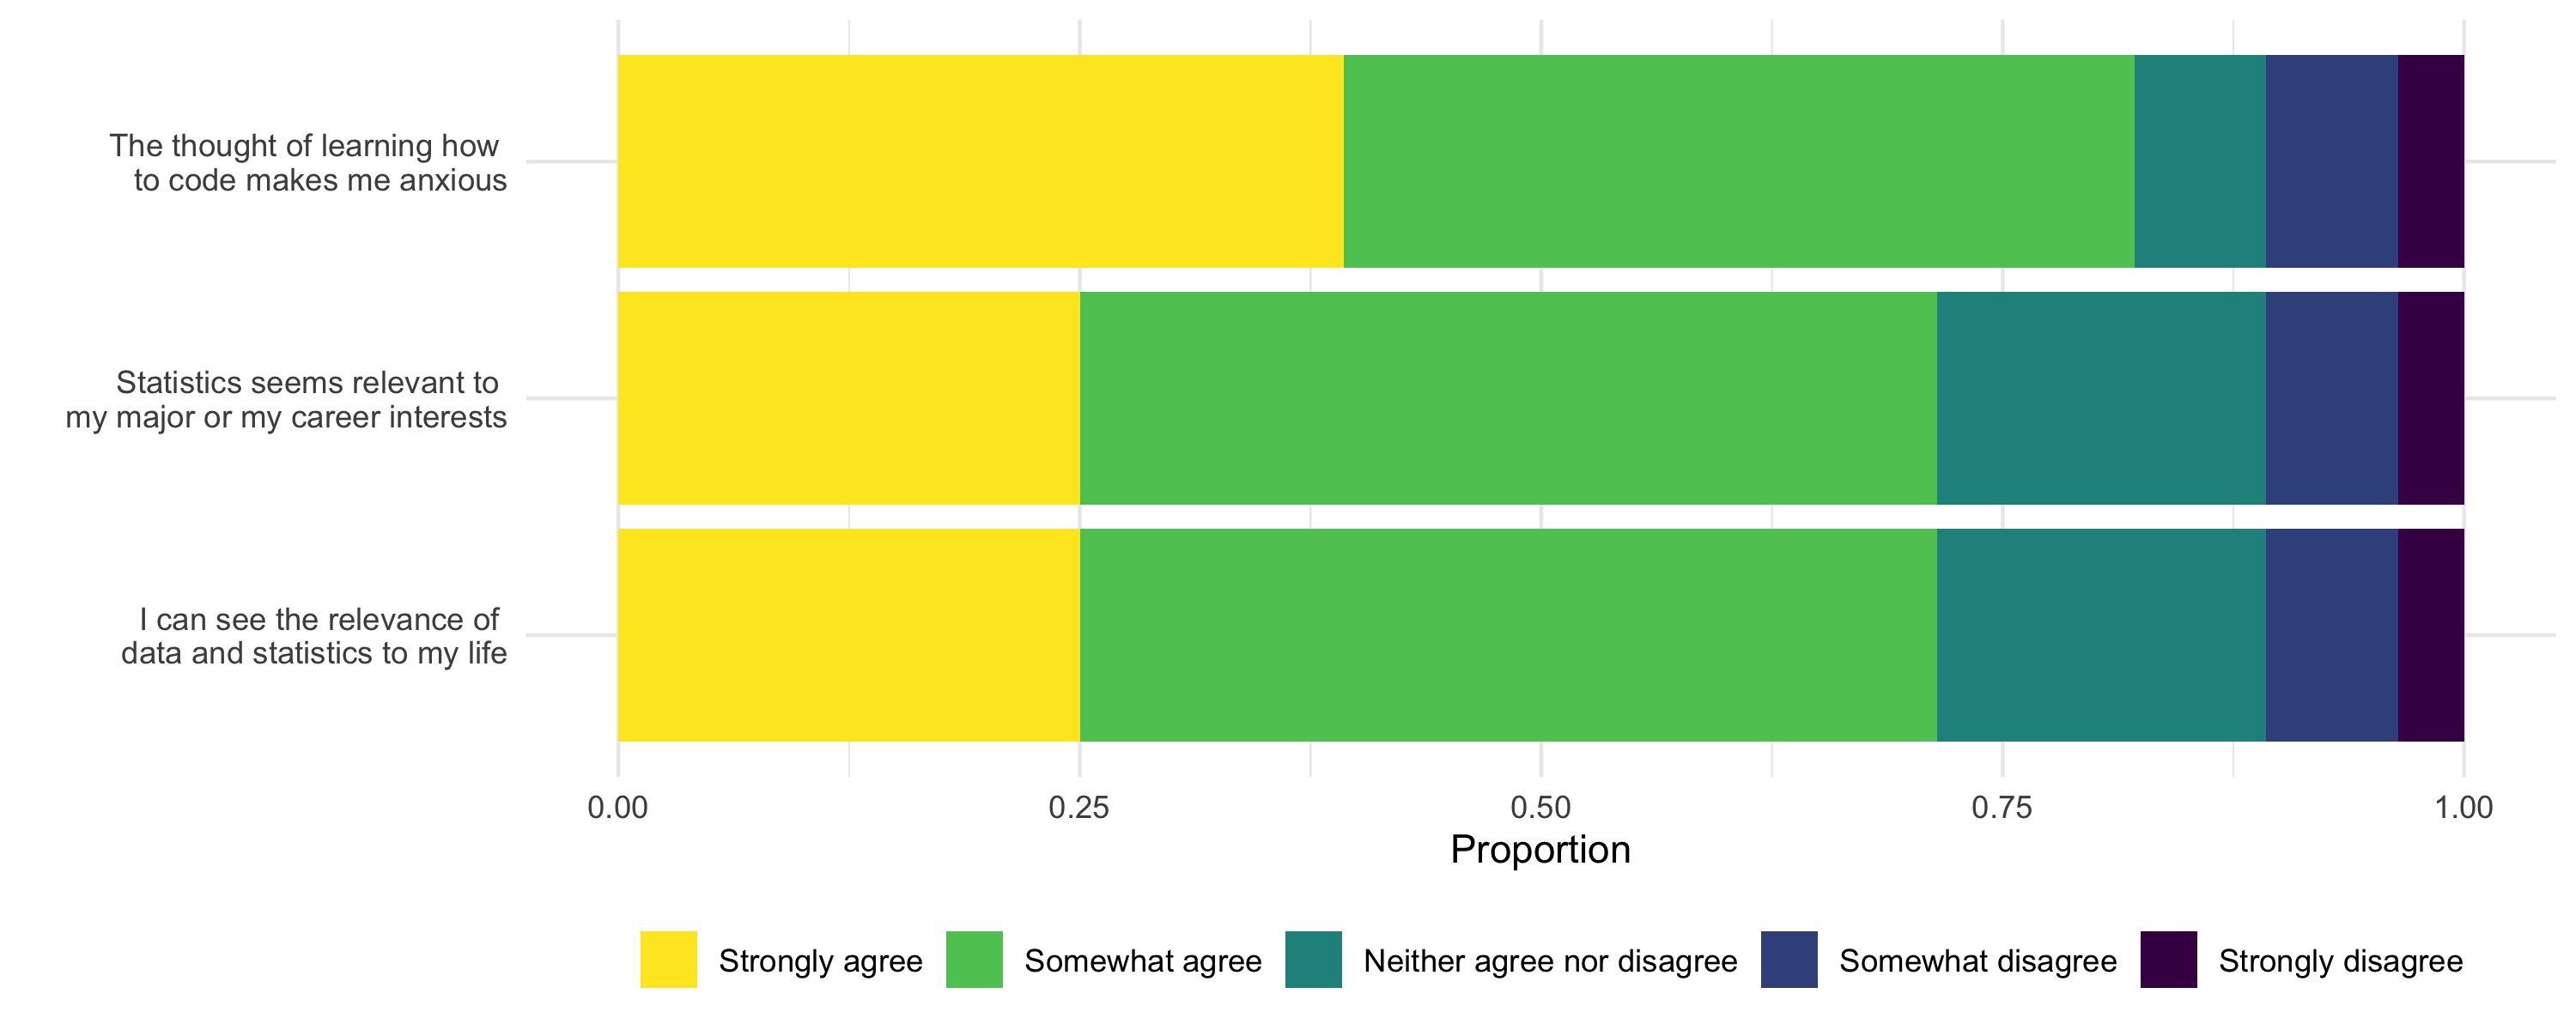
Hint: you will first need to use a pivot_longer and then use a case_when() to recode the levels of the new variable to be the full statements seen on the y-axis).
Submission
Before submitting your .html (as a .zip file to Blackboard):
- Check your code for neatness - add spaces and line breaks where appropriate to improve readability
- Check visualizations for clean titles and labels
- Suppress extraneous messages/warnings (e.g. set
#| warning: false,#| message: falseinside code chunks) - Ensure exercises are clearly labeled and your text responses are visually distinguished
- Confirm neat organization and readable structure
Render one last time, check the .html file for accuracy, then convert to .zip file to upload to Blackboard.
Grading (50 pts)
| Component | Points |
|---|---|
| Exercise 1 | 4 |
| Exercise 2 | 4 |
| Exercise 3 | 6 |
| Exercise 4 | 6 |
| Exercise 5 | 6 |
| Exercise 6 | 6 |
| Exercise 7 | 6 |
| Exercise 8 | 6 |
| Reflection prompts | 3 |
| Workflow & formatting | 3 |